Data Sources2,365 words, 11 minutes
Data revisions in FRED: ALFRED vintages and why final is not final
Every payroll and real GDP vintage since 2010, pulled from ALFRED without a key: how far first prints moved, the annual benchmarks, and the level trap.
A FRED series is a set of numbers as they stand today. Download PAYEMS this morning and the file says U.S. payrolls grew by 116,000 in 2025. Add up the twelve monthly changes for 2025 as the Bureau of Labor Statistics first published each one, and the total is 1,208,000. Neither figure is an error. They are two vintages of one series, and the St. Louis Fed keeps every vintage in ALFRED, its archive of data as it was known on past dates. This article pulls every payroll vintage since January 2010 and every real GDP vintage since April 2010 without an API key, measures how far the first published numbers moved afterwards, and ends with what that means for anyone who builds an analysis on a downloaded series. The raw pulls, the derived tables, and the script are attached. Nothing here is investment advice or a forecast.
FRED mode and ALFRED mode
The FRED API documentation draws the line in three sentences. Every source, release, series, and observation carries a real-time period, which "marks when facts were true or when information was known until it changed." By default that period is today: "This can be thought of as FRED® mode- what information about the past is available today." And "ALFRED® users can change the real-time period to retrieve information that was known as of a past period of history."
A vintage is one of those snapshots: the whole series as it stood after one publication. ALFRED's download page for PAYEMS lists 859 vintage dates, from 1955-05-06 to 2026-09-04. GDPC1 lists 418, from 1991-12-04 to 2026-08-26. For any single observation, the first vintage that contains it is its first print, the next is its first revision, and so on, and the latest vintage is exactly what the plain FRED CSV serves. Everything below is built from that one idea.
Pulling vintages without a key
The keyed API reaches vintages through realtime_start and realtime_end. Without a key, two public pages do the same work. The ALFRED download page for a series carries the full list of vintage dates in its form, and the CSV endpoint behind ALFRED's graphs accepts a comma-separated list of ids and a matching list of vintage dates, returning one column per vintage headed with the id and the date. Condensed from the attached script:
def fetch_vintages(series, vintages, batch=12):
    for i in range(0, len(vintages), batch):
        chunk = vintages[i:i + batch]
        url = ("https://alfred.stlouisfed.org/graph/alfredgraph.csv?id="
               + ",".join([series] * len(chunk))
               + "&vintage_date=" + ",".join(chunk))
        rows = list(csv.reader(get(url).splitlines()))
        expect = [f"{series}_{d.replace('-', '')}" for d in chunk]
        if rows[0][1:] != expect:
            sys.exit(f"unexpected columns {rows[0][1:]}")
        yield rows
        time.sleep(1.5)
Twelve vintages per request kept the pull of 201 payroll vintages and 195 GDP vintages to 34 CSV requests. The header check is not decoration. While testing, a malformed request came back with today's vintage under today's date instead of an error, and a script that trusted the column order would have written the current numbers into a historical column without complaint.
Payrolls: first print, third estimate, today
The BLS technical note on the benchmark describes the monthly cycle. The first preliminary estimate comes from an incomplete sample and is revised in each of the next two monthly releases as more reports arrive, so the third published figure is the last one based on the sample alone. Across the 186 months from January 2010 to June 2026 that have a third estimate, leaving out 2020, the average absolute move from first print to third estimate was 47,700 jobs, and the average signed move was +12,800. From first print to today's vintage the average absolute move was 69,300. With 2020 included, those become 50,100 and 74,300. The largest move outside 2020 is November 2021, first printed at +210,000 and now +658,000.
The size of a typical revision is familiar. The direction of recent ones matters more. Every month since January 2025, in thousands, with the vintage each figure first appeared in:
| month | first print | first published | third estimate | third published | today |
|---|---|---|---|---|---|
| 2025-01 | +143 | 2025-02-07 | +111 | 2025-04-04 | -48 |
| 2025-02 | +151 | 2025-03-07 | +102 | 2025-05-02 | +42 |
| 2025-03 | +228 | 2025-04-04 | +120 | 2025-06-06 | +67 |
| 2025-04 | +177 | 2025-05-02 | +158 | 2025-07-03 | +108 |
| 2025-05 | +139 | 2025-06-06 | +19 | 2025-08-01 | +13 |
| 2025-06 | +147 | 2025-07-03 | -13 | 2025-09-05 | -20 |
| 2025-07 | +73 | 2025-08-01 | +72 | 2025-11-20 | +64 |
| 2025-08 | +22 | 2025-09-05 | -26 | 2025-12-16 | -70 |
| 2025-09 | +119 | 2025-11-20 | +108 | 2026-01-09 | +76 |
| 2025-10 | -105 | 2025-12-16 | -140 | 2026-02-11 | -140 |
| 2025-11 | +64 | 2025-12-16 | +41 | 2026-02-11 | +41 |
| 2025-12 | +50 | 2026-01-09 | -17 | 2026-03-06 | -17 |
| 2026-01 | +130 | 2026-02-11 | +160 | 2026-04-03 | +160 |
| 2026-02 | -92 | 2026-03-06 | -156 | 2026-05-08 | -156 |
| 2026-03 | +178 | 2026-04-03 | +214 | 2026-06-05 | +214 |
| 2026-04 | +115 | 2026-05-08 | +148 | 2026-07-02 | +148 |
| 2026-05 | +172 | 2026-06-05 | +63 | 2026-08-07 | +63 |
| 2026-06 | +57 | 2026-07-02 | +31 | 2026-09-04 | +31 |
| 2026-07 | -23 | 2026-08-07 | n/a | n/a | +21 |
| 2026-08 | +162 | 2026-09-04 | n/a | n/a | +162 |
Six months in the whole 200-month file changed sign between first print and today, and five of them are in that table: January 2025 (+143 to -48), June 2025 (+147 to -20), August 2025 (+22 to -70), December 2025 (+50 to -17), and July 2026 (-23 to +21). The sixth is September 2017, first printed at -33 and now +89. The table also records a gap in the calendar itself: ALFRED holds no payroll vintage between 2025-09-05 and 2025-11-20, and October 2025 first appeared on 2025-12-16 in the same release as November. We did not read a BLS notice about that period, so this article does not state a reason for it.
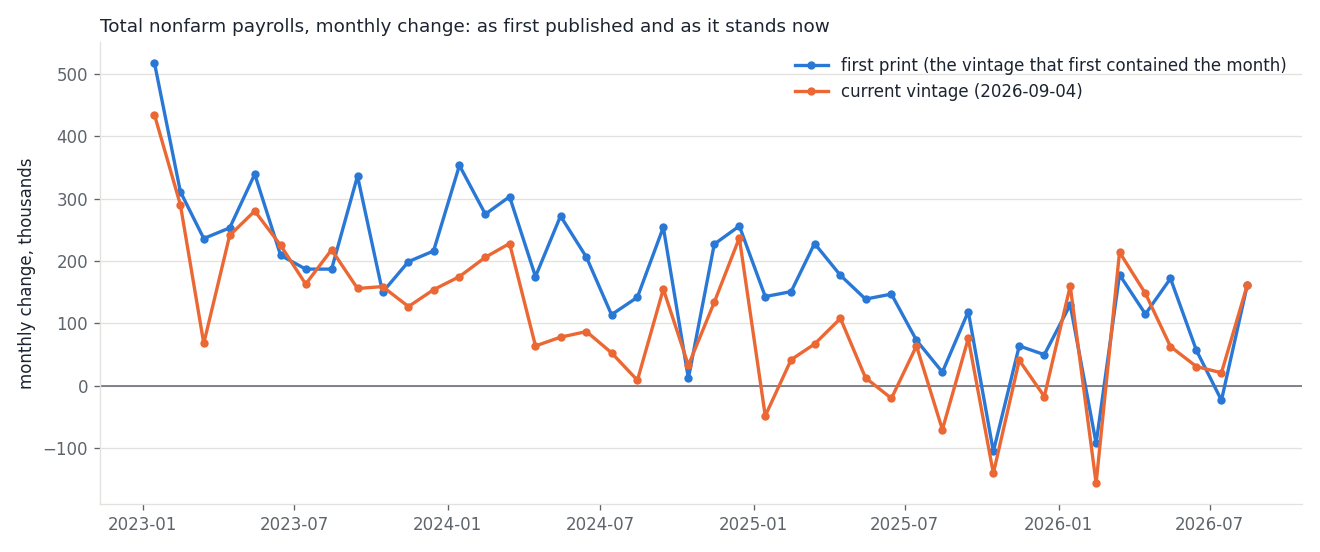
A calendar year, as printed and as revised
Summing monthly changes turns small revisions into large ones. In this table, in thousands, the first column adds up each year's twelve changes as first published, and the second is today's vintage. The last two columns split the gap into the sample revisions (first print to third estimate) and everything that arrived afterwards (third estimate to today), which is where the annual benchmark and the yearly seasonal-factor updates land.
| year | sum of first prints | today | difference | first print to third | third to today |
|---|---|---|---|---|---|
| 2019 | +2,051 | +1,985 | -66 | +101 | -167 |
| 2020 | -8,856 | -9,246 | -390 | -185 | -205 |
| 2021 | +5,331 | +7,268 | +1,937 | +1,904 | +33 |
| 2022 | +4,619 | +4,526 | -93 | -66 | -27 |
| 2023 | +3,140 | +2,515 | -625 | -360 | -265 |
| 2024 | +2,589 | +1,459 | -1,130 | -241 | -889 |
| 2025 | +1,208 | +116 | -1,092 | -673 | -419 |
| 2026, Jan-Aug | +699 | +643 | -56 | -100 | 0 |
For 2026 the split covers only the six months that already have a third estimate; July's +44 revision sits in the difference column alone. Earlier years ran the other way. Every year from 2010 to 2014 was revised up, by between 307,000 (2010) and 678,000 (2011), and 2021's upward revision of 1,937,000 arrived almost entirely inside the three-month sample window. The last three full years were each revised down. 2024 lost 1,130,000 jobs between its first prints and today, and 889,000 of that came after the third estimates; 2025 lost 1,092,000, with 673,000 of it inside the sample window. Anyone who fitted a trend to the 2024 or 2025 first prints was fitting a labor market that today's data does not show.
The benchmark: one March, rewritten every February
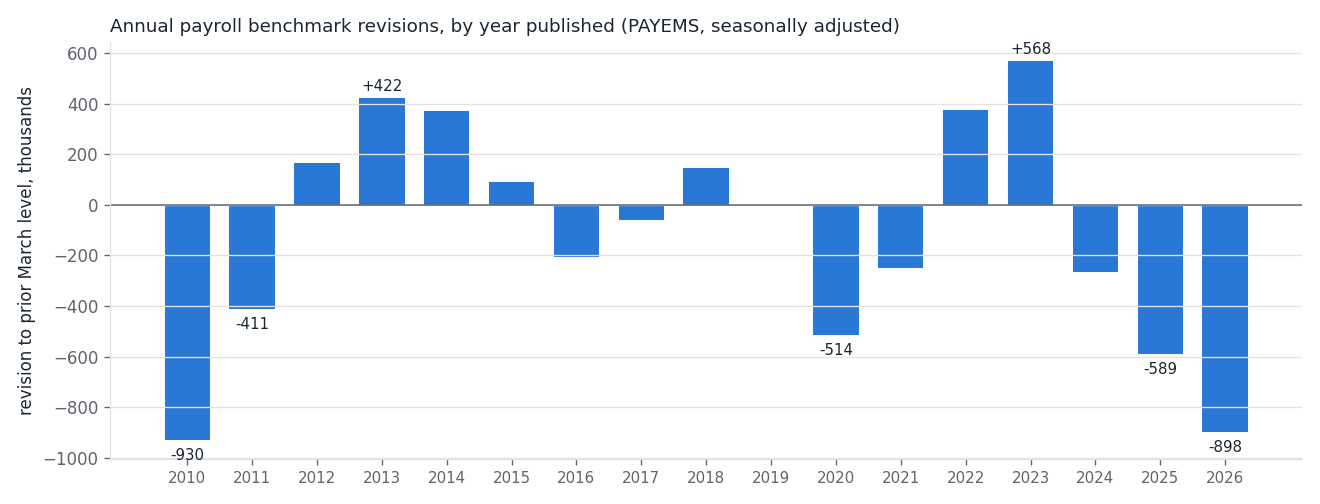
According to the BLS technical note, once a year the sample-based total for March is realigned to population counts from unemployment-insurance records, and the benchmark revision is published with the January estimates each February. The attached script finds it in ALFRED without being told any dates: it takes the first vintage that contains January of a year, and compares the previous March's level there with the same March in the vintage immediately before.
| published | March of | before | after | revision | percent |
|---|---|---|---|---|---|
| 2010-02-05 | 2009 | 133,000 | 132,070 | -930 | -0.70% |
| 2011-02-04 | 2010 | 129,849 | 129,438 | -411 | -0.32% |
| 2012-02-03 | 2011 | 130,757 | 130,922 | +165 | +0.13% |
| 2013-02-01 | 2012 | 132,863 | 133,285 | +422 | +0.32% |
| 2014-02-07 | 2013 | 135,313 | 135,682 | +369 | +0.27% |
| 2015-02-06 | 2014 | 137,964 | 138,055 | +91 | +0.07% |
| 2016-02-05 | 2015 | 141,178 | 140,972 | -206 | -0.15% |
| 2017-02-03 | 2016 | 143,733 | 143,673 | -60 | -0.04% |
| 2018-02-02 | 2017 | 145,823 | 145,969 | +146 | +0.10% |
| 2019-02-01 | 2018 | 148,280 | 148,279 | -1 | 0.00% |
| 2020-02-07 | 2019 | 150,796 | 150,282 | -514 | -0.34% |
| 2021-02-05 | 2020 | 151,090 | 150,840 | -250 | -0.17% |
| 2022-02-04 | 2021 | 144,057 | 144,431 | +374 | +0.26% |
| 2023-02-03 | 2022 | 150,856 | 151,424 | +568 | +0.38% |
| 2024-02-02 | 2023 | 155,472 | 155,206 | -266 | -0.17% |
| 2025-02-07 | 2024 | 158,106 | 157,517 | -589 | -0.37% |
| 2026-02-11 | 2025 | 159,275 | 158,377 | -898 | -0.56% |
This doubles as a test of the method. For March 2025 the difference between the two vintages is -898,000, and the BLS benchmark article dated February 11, 2026 gives the seasonally adjusted revision to March 2025 as -898,000, or 0.6 percent. Of the 17 benchmarks in the file, ten were negative, the mean absolute size was 368,000, and the 2026 and 2025 releases are the second and third largest, behind only 2010's. Because the two vintages are consecutive releases, each row is everything that February release changed in that March, not only the benchmark component.
GDP: advance estimates, and why levels cannot be compared
BEA's release notes say it "releases three vintages of the current quarterly estimate for GDP." Advance estimates "are released near the end of the first month following the end of the quarter and are based on source data that are incomplete or subject to further revision by the source agency." After that, annual updates "generally cover at least the five most recent calendar years", and comprehensive updates are carried out "at about 5-year intervals".
The script computes annualized quarterly growth inside each vintage from the levels. Across the 60 quarters from 2010Q2 to 2026Q1 excluding 2020, growth moved an average of 0.46 percentage points in absolute terms from the advance estimate to the third vintage, and 0.95 points from the advance estimate to today, with a signed mean of +0.29. In 24 of those 60 quarters, today's figure is more than a full point away from the advance estimate; with 2020 included, the average absolute move is 1.01 points. The largest move outside 2020 is 2015Q1, advance +0.25 percent and now +3.65. Five quarters changed sign:
| quarter | advance estimate | published | today |
|---|---|---|---|
| 2011Q1 | +1.7 | 2011-04-28 | -0.9 |
| 2011Q3 | +2.5 | 2011-10-27 | -0.1 |
| 2012Q4 | -0.1 | 2013-01-30 | +0.5 |
| 2014Q1 | +0.1 | 2014-04-30 | -1.4 |
| 2022Q2 | -0.9 | 2022-07-28 | +0.6 |
The GDP vintage list has its own gap, between 2025-09-25 and 2025-12-23, and here the agency did say why. BEA's December 10, 2025 schedule notice states that the advance estimate of third-quarter GDP, "originally scheduled during October, was canceled", replaced by an initial estimate on December 23 and an updated estimate on January 22, and that the fourth-quarter advance estimate would move from January 29, 2026 because "Sufficient source data will not be available in time for the original release date." In the file, 2025Q3 first appears on 2025-12-23 at +4.3 percent (+4.4 today), and 2025Q4 first appears on 2026-02-20 at +1.4, was +0.5 by the 2026-04-09 vintage, and is +0.5 today. The newest quarter, 2026Q2, has two vintages so far, both rounding to +1.5.
Levels are a different matter. The level of 2015Q1 was 16,304.8 billion in its first vintage here (2015-04-29) and is 18,666.6 today, and the two biggest single-vintage moves were +5.53 percent on 2018-07-27 and +8.02 percent on 2023-09-28. ALFRED's units history for the series gives the reason: chained 2009 dollars through 2018-07-26, chained 2012 dollars from 2018-07-27, and chained 2017 dollars from 2023-09-28. Neither jump says early 2015 was a bigger economy than first thought; the unit changed. A growth rate computed inside one vintage has no unit, which is why the script never compares a level across vintages.
What this changes in an analysis
Three habits follow from the numbers, and none of them is about markets. First, a downloaded macro series is one vintage, so the file and its retrieval date belong with any published result. Second, any rule or backtest that reacts to a macro release should be fed the vintage that existed on each decision date, because today's vintage contains information nobody had then; with payrolls that information amounted to more than a million jobs in each of 2024 and 2025. Third, revisions are not guaranteed to average out over the window someone happens to study. Over the full file, first prints were revised up on average, yet the 2023, 2024, and 2025 totals were all revised down. The data shows that pattern in the past and says nothing about whether it continues.
The files, and the limits
datasets/alfred-vintages-data-revisions-payems-vintages.csv is the raw payroll pull: observation_date, then 201 columns named PAYEMS_ plus the vintage date, from 2010-01-08 to 2026-09-04, in thousands of persons, for 224 monthly observations from January 2008; a blank cell means that month had not been published in that vintage. -gdpc1-vintages.csv is the same shape for real GDP: 195 vintages from 2010-04-30 to 2026-08-26 and 74 quarterly observations from 2008Q1, each column in whatever chained-dollar unit that vintage used. alfred-vintages-data-revisions.csv has 200 rows: month, first_vintage, first_change_k, third_vintage, third_change_k, current_vintage, current_change_k, rev_first_to_third_k, rev_first_to_current_k, n_vintages. -benchmarks.csv has 17 rows: benchmark_year, march_reference, vintage_before, vintage_after, level_before_k, level_after_k, revision_k, revision_pct. -gdp.csv has 65 rows: quarter, advance_vintage, advance_growth_saar_pct, third_vintage, third_vintage_growth_saar_pct, current_vintage, current_growth_saar_pct, the two revision columns, and n_vintages. Run python code/alfred-vintages-data-revisions.py --download --figures to refresh everything; the numbers need only the standard library, and the charts need matplotlib 3.10.9.
The limits are real. The vintage list is read from an HTML page and the CSV endpoint is the one ALFRED's own graphs use, not the documented keyed API, so either could change; the header check will stop the script rather than write wrong data. "Third" means the third vintage containing an observation. In an ordinary month that is BLS's third estimate and in an ordinary quarter it is BEA's, but during the late-2025 gaps it is not: the third vintage for 2025Q3 is the 2026-02-20 release, which was not a third estimate. Growth computed from FRED's published levels can differ by a tenth of a point from BEA's headline, which is computed before rounding. The benchmark rows include every other change the February release made to that March. And today's column is only the latest vintage: the next payroll release will change some of it, and BEA says annual updates are released in late September, so the GDP figures for recent years may not match this file for long.