Data Analysis2,900 words, 13 minutes
Month-of-year effects in market data, under a false discovery rate
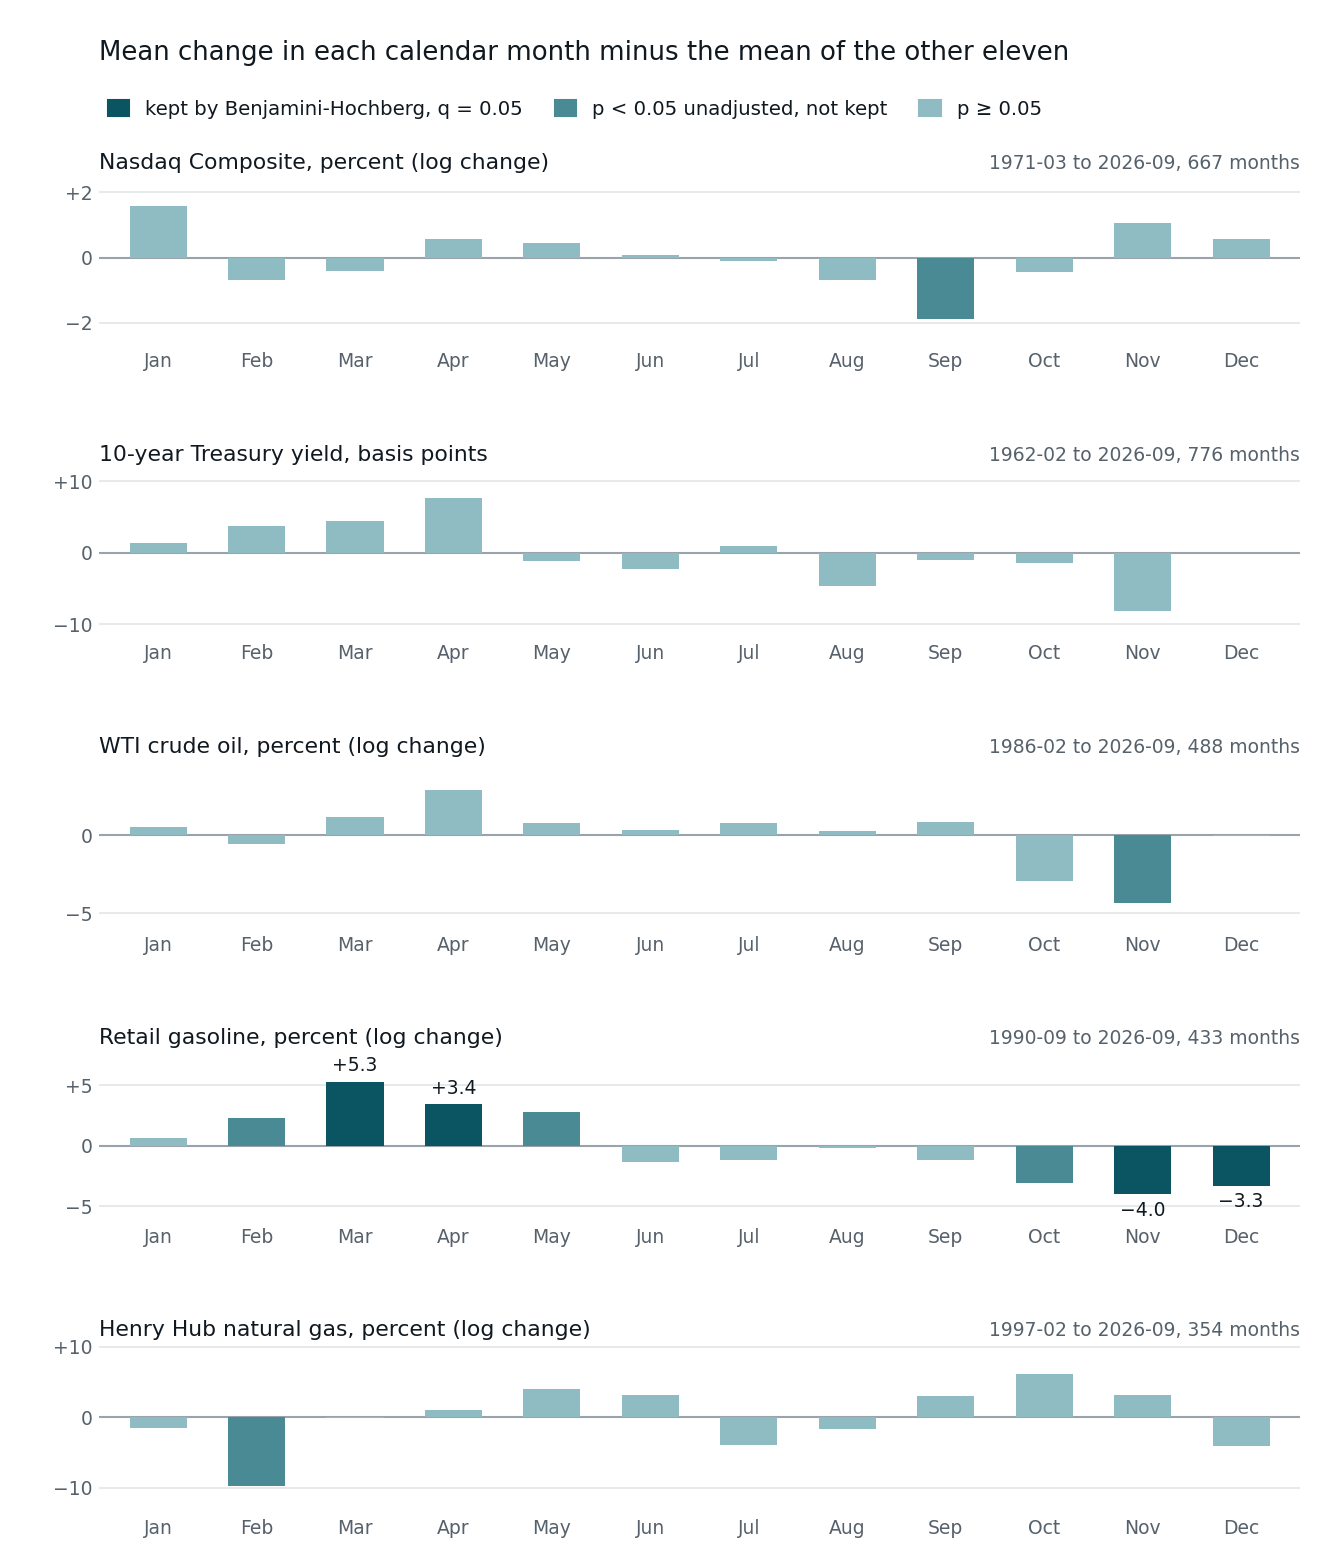
Sixty month-of-year tests on the Nasdaq, Treasuries, oil, gasoline and natural gas: 10 pass at p < 0.05, and a 5% false discovery rate keeps 4, all gasoline.
Test every calendar month in five price series and you have asked sixty questions. We asked them of the Nasdaq Composite, the 10-year Treasury yield, WTI crude oil, retail gasoline and Henry Hub natural gas, using every month-end FRED holds for each, from as early as February 1962 to September 2026. Ten came back with p below 0.05, against 3.0 expected if no month mattered anywhere. A Benjamini-Hochberg false discovery rate of 5 percent keeps four of the ten, and all four are retail gasoline: prices rise in March and April and fall in November and December, the pattern the U.S. Energy Information Administration describes. Nothing in the Nasdaq, Treasuries, crude oil or natural gas survives any correction, the Nasdaq's weak Septembers included. Below are the plan we fixed before computing anything, the four corrections side by side, a test of the first half's discoveries on the second half, and the two calendar rules for stocks that have names. The datasets and the script that printed every number are attached. Nothing here is investment advice.
The plan, fixed before the first p value
A screen like this can be bent after the fact, by choosing the series, the window or the threshold once the results are in view. So we wrote all of it down before computing any statistic:
- Five FRED series, as changes between month-ends, where a month-end is the last observation dated in the calendar month. Log changes in percent for the Nasdaq Composite (
NASDAQCOM), WTI crude oil (DCOILWTICO), retail regular gasoline (GASREGW) and Henry Hub natural gas (DHHNGSP); changes in basis points for the 10-year Treasury yield (DGS10). Each runs from its first month-end to September 2026, because October was incomplete when the data was pulled on October 9. - One test per series and calendar month: that month's mean change minus the mean of the other eleven months, with a two-sided permutation p from 20,000 shuffles of the month labels under a fixed seed. Five series times twelve months is a family of 60 tests.
- Four corrections at 0.05: Bonferroni, Holm, Benjamini-Hochberg and Benjamini-Yekutieli, with the unadjusted count beside them.
- A replication: split each series at its middle month, screen the first half the same way, and test every first-half discovery on the second half, one-sided in the direction it was found.
- Two hypotheses stated in advance, both about the Nasdaq: January beats the other eleven months, and November to April beats May to October.
- A positive control: retail gasoline, whose seasonality the EIA documents and explains. If the tests could not find it, they could not be trusted to find anything.
One analysis was added after the plan, and it is labelled where it appears: the same corrections run on Welch t p values, because of what the natural gas data turned out to look like.
The data
| Series | FRED id | Source | Monthly changes | n | sd | lag-1 autocorrelation |
|---|---|---|---|---|---|---|
| Nasdaq Composite | NASDAQCOM | Nasdaq, Inc. | Mar 1971 to Sep 2026 | 667 | 6.03% | +0.102 |
| 10-year Treasury yield | DGS10 | Federal Reserve Board, H.15 | Feb 1962 to Sep 2026 | 776 | 32.03 bp | +0.101 |
| WTI crude oil | DCOILWTICO | EIA | Feb 1986 to Sep 2026 | 488 | 10.80% | +0.128 |
| Retail gasoline | GASREGW | EIA, weekly survey | Sep 1990 to Sep 2026 | 433 | 6.40% | +0.269 |
| Henry Hub natural gas | DHHNGSP | EIA | Feb 1997 to Sep 2026 | 354 | 18.60% | -0.183 |
All five came from FRED's CSV endpoint on October 9, with no API key; the FRED article covers that endpoint. The gasoline price is a survey, in FRED's words a "Weighted average based on sampling of approximately 900 retail outlets, 8:00AM Monday", so its month-end is the last Monday reading of the month.
Three gaps matter for a month-end method. The gasoline series is blank from 10 December 1990 to 14 January 1991, so its December 1990 reading is dated 3 December. WTI's March 1999 reading is dated 24 March. And Henry Hub's daily series has holes in its early years: 22 of its month-end readings fall a week or more before the month ended (May 2003's is dated 1 May), and March 2004 has no reading at all, which removes two monthly changes. We kept the plan's rule rather than patch the gaps, so a few changes start or end early.
Rights decided what ships. FRED tags the Treasury yield and the three EIA series "public domain: citation requested", and the EIA's own reuse page says that "U.S. government publications are in the public domain and are not subject to copyright protection." The Nasdaq Composite is tagged "Copyrighted: Pre-Approval Required" and carries a copyright notice from NASDAQ OMX Group. So the monthly file attached here holds the four public-domain series only, and for the Nasdaq the results file carries per-month statistics; the script fetches the index itself when it runs.
Sixty tests, ten hits
For each series and month the statistic is the month's mean change minus the mean of the other eleven months. The permutation p asks how often a random relabelling of months produces a difference at least that far from zero; Welch's t is printed beside it. Units are percent per month, log change, for every series in this table.
| Series | Month | n | Month mean | Other months | Difference | Welch t | Permutation p | BH-adjusted p | Kept by |
|---|---|---|---|---|---|---|---|---|---|
| Retail gasoline | Mar | 36 | +5.13 | -0.14 | +5.28 | +3.74 | 0.00005 | 0.0030 | all four |
| Retail gasoline | Nov | 36 | -3.40 | +0.63 | -4.03 | -3.49 | 0.00040 | 0.0120 | Bonferroni, Holm, BH |
| Retail gasoline | Apr | 36 | +3.45 | +0.01 | +3.44 | +3.45 | 0.00240 | 0.0360 | BH |
| Retail gasoline | Dec | 36 | -2.75 | +0.57 | -3.32 | -3.20 | 0.00240 | 0.0360 | BH |
| Retail gasoline | Oct | 36 | -2.54 | +0.55 | -3.09 | -2.48 | 0.00655 | 0.0765 | none |
| Henry Hub natural gas | Feb | 30 | -8.94 | +0.80 | -9.74 | -2.19 | 0.00765 | 0.0765 | none |
| Retail gasoline | May | 36 | +2.85 | +0.06 | +2.79 | +2.88 | 0.01360 | 0.1166 | none |
| WTI crude oil | Nov | 40 | -3.63 | +0.68 | -4.32 | -2.44 | 0.01685 | 0.1264 | none |
| Nasdaq Composite | Sep | 56 | -0.89 | +1.00 | -1.89 | -2.18 | 0.02440 | 0.1627 | none |
| Retail gasoline | Feb | 36 | +2.37 | +0.11 | +2.26 | +2.36 | 0.04300 | 0.2580 | none |
If no calendar month mattered in any of the five series, 60 tests at 0.05 would produce 3.0 hits on average. Ten is more than that, and seven of the ten are gasoline. The other three are the kind that get written up: a Nasdaq September that averages -0.89 percent against +1.00 for the other months, a crude oil November 4.32 points weaker than the rest, and a natural gas February 9.74 points weaker.
Four corrections
| Procedure | What it controls | Smallest threshold | Kept | Which |
|---|---|---|---|---|
| None | nothing | 0.05 | 10 | 7 gasoline months, Nasdaq Sep, WTI Nov, natural gas Feb |
| Bonferroni | the chance of any false positive | 0.000833 | 2 | gasoline Mar, Nov |
| Holm | the same, stepped down | 0.000833 | 2 | gasoline Mar, Nov |
| Benjamini-Hochberg | the expected share of false positives among those kept | 0.000833 | 4 | gasoline Mar, Apr, Nov, Dec |
| Benjamini-Yekutieli | the same share, under any dependence | 0.000178 | 1 | gasoline Mar |
Bonferroni tests every p against 0.05 / 60. Holm starts at the same line and relaxes it one test at a time (0.05 / 59, then 0.05 / 58), stopping at the first miss; here the third-smallest p, 0.0024, misses 0.000862, so Holm keeps the same two. Both control the familywise error rate: the probability that even one of the kept results is false.
Benjamini and Hochberg's 1995 paper controls something else, "the expected proportion of falsely rejected hypotheses", which they named the false discovery rate and which, in their words, "is equivalent to the FWER when all hypotheses are true but is smaller otherwise." Their procedure sorts the p values and keeps everything up to the largest rank i whose p is at most i x q / m. Here q = 0.05 and m = 60:
| Rank i | Test | Permutation p | i x 0.05 / 60 | Result |
|---|---|---|---|---|
| 1 | Gasoline, Mar | 0.00005 | 0.00083 | below the line |
| 2 | Gasoline, Nov | 0.00040 | 0.00167 | below the line |
| 3 | Gasoline, Apr | 0.00240 | 0.00250 | below the line |
| 4 | Gasoline, Dec | 0.00240 | 0.00333 | below the line |
| 5 | Gasoline, Oct | 0.00655 | 0.00417 | above |
| 6 | Natural gas, Feb | 0.00765 | 0.00500 | above |
No p from rank 5 to rank 60 gets back under its line, so four are kept. Rank 3 clears by only 0.0001, less than the Monte Carlo error of a p from 20,000 shuffles (0.00035 at p = 0.0024). That does not decide anything: a step-up procedure keeps everything to the last rank that passes, and rank 4 clears its line by 0.0009, 2.7 standard errors.
The guarantee has a condition. The 1995 paper proves the procedure for independent test statistics, and Benjamini and Yekutieli extended it in 2001 to statistics with "positive regression dependency". Their abstract continues: "For all other forms of dependency, a simple conservative modification of the procedure controls the false discovery rate." The modification divides q by 1 + 1/2 + ... + 1/m, which is 4.6799 for m = 60. Our twelve tests within a series are not positively dependent. They are built from the same months, and a large January raises the "other months" mean against which every other month is measured, so the differences are pulled in opposite directions. The conservative version keeps one test, gasoline in March.
The corrections take a few lines of standard-library Python. This is the start of corrections() in the attached script:
m = len(ps)
order = sorted(range(m), key=lambda i: (ps[i], i))  # smallest p first
hm = sum(1 / j for j in range(1, m + 1))             # 4.6799 for m = 60
kept = {"raw": {i for i in range(m) if ps[i] < alpha},
        "bonferroni": {i for i in range(m) if ps[i] <= alpha / m}}
holm = set()
for rank, i in enumerate(order, 1):                  # step down: stop at the first miss
    if ps[i] > alpha / (m - rank + 1):
        break
    holm.add(i)
kept["holm"] = holm
for name, q in (("bh", alpha), ("by", alpha / hm)):
    k = 0
    for rank, i in enumerate(order, 1):              # step up: keep up to the last pass
        if ps[i] <= rank * q / m:
            k = rank
    kept[name] = set(order[:k])
The control that worked, and the one that did not
The EIA's description of gasoline is plain: "Historically, retail gasoline prices tend to gradually rise in the spring and peak in late summer, when people drive more frequently. Gasoline prices are generally lower in winter months." It adds a supply reason: summer gasoline must be "less prone to evaporate during warm weather", so refiners "must replace cheaper (but more evaporative) gasoline components with less evaporative but more expensive components."
The tests find that shape. Gasoline's month-end price rose on average in February through May, by 2.37, 5.13, 3.45 and 2.85 percent, and fell in October through December, by 2.54, 3.40 and 2.75 percent. Asked as one question per series (are the twelve monthly means equal?), gasoline is the only series of the five that says yes. Its permutation p is 0.00005, the smallest that 20,000 shuffles can produce, and the other four run from 0.153 for natural gas to 0.513 for the 10-year yield.
Natural gas has a seasonal story too. The EIA writes that "During cold months, natural gas demand for heating by residential and commercial consumers generally increases the overall natural gas demand and can put upward pressure on prices." It did not show up as a predictable month-to-month change in this spot price. What is seasonal is the size of the moves: the standard deviation of the monthly change is 10.1 percent in April and 23.7 percent in February.
That breaks an assumption. Shuffling month labels treats the months as interchangeable, and a February more than twice as volatile as April is not interchangeable with it. The permutation p for natural gas in February, 0.00765, is too small for that reason; Welch's t, which uses February's own variance, is -2.19 on 32.1 degrees of freedom, p = 0.036. This check was not in the plan, so we ran the four corrections again on the Welch p values. The unadjusted hits are the same ten cells. Benjamini-Hochberg keeps the same four gasoline months. Bonferroni and Holm keep only March (Welch p 0.00059), and Benjamini-Yekutieli keeps nothing. The Benjamini-Hochberg answer does not depend on which p value we use; Bonferroni, Holm and Benjamini-Yekutieli each lose one test.
Holding out half the sample
Benjamini and Hochberg list screening among the uses of the false discovery rate, because "too large a fraction of false leads would burden the second phase of the confirmatory analysis." So we ran the second phase. Each series was split at its middle month (the Nasdaq's first half ends in November 1998, gasoline's in August 2008), the first halves were screened with the same 60 tests, and each first-half discovery was tested on the second half in the direction it was found.
| Procedure | First-half discoveries | Replicated in the second half |
|---|---|---|
| None (p < 0.05) | 5 | 2 |
| Bonferroni | 1 | 0 |
| Holm | 1 | 0 |
| Benjamini-Hochberg | 2 | 1 |
| Benjamini-Yekutieli | 0 | 0 |
| First-half discovery | First half | p | Second half | One-sided p | Replicated |
|---|---|---|---|---|---|
| Gasoline, Apr | +4.78 | 0.00060 | +2.11 | 0.11309 | no |
| Gasoline, Mar | +4.42 | 0.00085 | +6.13 | 0.00005 | yes |
| Nasdaq Composite, Jan | +2.79 | 0.01255 | +0.40 | 0.38593 | no |
| Gasoline, Nov | -2.78 | 0.04620 | -5.27 | 0.00215 | yes |
| WTI crude oil, Nov | -4.50 | 0.04740 | -4.14 | 0.06560 | no |
Counts this small cannot rank the procedures, and we do not try. They show the shape of the problem instead. The strongest first-half result, gasoline in April at p 0.0006 and the only one Bonferroni kept, shrank from 4.78 points to 2.11 and missed. Gasoline in March, second in the first half, came back stronger. All five kept their sign; two cleared the bar.
Two rules for stocks, written down in advance
The plan's two Nasdaq hypotheses are the calendar rules with names: the January effect, and "sell in May and go away". Written down as one-sided tests before any statistic was computed, they do not pay for the other 58 cells, only for each other, so we hold them to Holm at 0.05: the smaller p must be below 0.025.
| Nasdaq Composite | January minus other months | p | Nov-Apr minus May-Oct | p | Holm keeps |
|---|---|---|---|---|---|
| Mar 1971 to Sep 2026 | +1.57 | 0.0284 | +0.80 | 0.0433 | neither |
| Mar 1971 to Nov 1998 | +2.79 | 0.0028 | +1.46 | 0.0082 | both |
| Dec 1998 to Sep 2026 | +0.40 | 0.3859 | +0.15 | 0.4138 | neither |
Over the full sample January averages +2.28 percent against +0.71 for the other months, and November to April beats May to October by 0.80 points a month. Each would pass on its own at 0.05. Together they do not: January's 0.0284 misses 0.025, and Holm stops there. In the first half both clear easily. In the 334 months since December 1998 both are gone, a January premium of 0.40 points with p 0.39 and a winter premium of 0.15 points with p 0.41. On this index the two rules describe 1971 to 1998.
The Nasdaq's weakest month in the screen, September, was not in the plan. Its p of 0.0244 ranks ninth of 60, and no correction keeps it.
What this does not show
- Interchangeable months. The permutation test treats months as exchangeable. Seasonal volatility breaks that, which is why the Welch check is there, and so does serial correlation: lag-1 autocorrelations run from -0.183 for natural gas to +0.269 for gasoline.
- Calendar months, not exact ones. A month-end here is the last reading dated in the month: a Monday for gasoline, a trading day for the rest, and an earlier day where FRED has gaps.
- The family is a choice. The thresholds depend on m. Add ten series with no seasonality and every Benjamini-Hochberg line moves down. Fixing the family in advance makes the count honest; it does not make the family the right one.
- One equity index. The Nasdaq Composite is not the broad market. The S&P 500 was not an option for a 55-year study on FRED, for the licensing and history reasons set out in the FOMC event study.
- Not a strategy. Retail gasoline is a survey average of pump prices, not something anyone can trade, and nothing here counts costs or execution. The backtest overfitting article shows what happens when the best of many tested rules is reported alone.
Reproducing it
code/month-of-year-effects-false-discovery-rate.py uses only the standard library for every number. --download fetches the five series from FRED with no key, --raw-dir reads saved copies instead, --csv writes the three files below, and --figures redraws the chart with matplotlib. The seeds are fixed at 20261009 plus an offset per series and sample, two runs write byte-identical files, and a full run took 17 seconds when we built this article. SciPy's scipy.stats.false_discovery_control and statsmodels' multipletests reproduce the adjusted p values in the results file.
The three files are datasets/month-of-year-effects-false-discovery-rate.csv (the results, 180 rows), datasets/month-of-year-effects-false-discovery-rate-series.csv (one row per series and sample, 15 rows) and datasets/month-of-year-effects-false-discovery-rate-monthly.csv (776 monthly rows, February 1962 to September 2026).
_README:
- results file:
seriesandlabel;unit,% (log)orbp;sample,full,firstorsecond;first_monthandlast_month;month(1 to 12) andmonth_name;n;mean_month,mean_otheranddiff;sd_month;welch_t,welch_dfandp_welch;p_two, the two-sided permutation p;p_upandp_down, the one-sided ones;p_bh,p_by,p_holmandp_bonferroni, the permutation p adjusted within the 60 tests of the same sample - series file:
n,mean,sdandlag1_autocorrof the monthly changes;p_omnibus, the permutation p for equal month means;nov_apr_minus_may_octandp_nov_apr_up;drawsandseed - monthly file: for
DGS10,DCOILWTICO,GASREGWandDHHNGSP, the date of the month-end reading (_date), the level as FRED wrote it (_level) and the change from the previous month-end (_change, basis points forDGS10, percent log change for the others); empty where a series has no change that month. The Nasdaq Composite is not in this file.