Methods2,510 words, 11 minutes
Reviewed by C. B. Zakarian on
Real versus nominal: deflating a series correctly, and six mistakes
From January 2021 to August 2026, real hourly pay fell 0.8% by the CPI and rose 1.7% by the PCE price index. How to deflate, checked against the BLS, and six traps.
Average hourly earnings for private-sector employees rose 26.16 percent between January 2021 and August 2026. Deflated by the Consumer Price Index, an hour of pay bought 0.81 percent less at the end of that stretch than at the start. Deflated by the PCE price index, it bought 1.70 percent more. Same pay, same months, opposite signs. This article sets out the arithmetic of deflating, checks it against the Bureau of Labor Statistics' own real-earnings series (our version matches it to the cent in every month both cover), and works through six mistakes with numbers from FRED, the BLS and the BEA. The script code/real-versus-nominal-deflating-correctly.py recomputes every number we derived below from the two attached datasets. Nothing here is investment advice; it describes public statistics.
The arithmetic
A real value is a nominal value divided by a price index, scaled so that the index equals one in the period whose prices you want to use. A real change is the nominal change divided by the price change, not reduced by it:
real = nominal * cpi[ref] / cpi[t]          # the value at month t, in the prices of month ref
real_change = (1 + g) / (1 + infl) - 1      # g and infl: nominal growth and inflation over one window
The BEA's handbook for the national accounts gives the same rule: quantities "are calculated by dividing the current-dollar value of the component by an 'appropriate' price index (with the reference-year value set to 100)", and its worked example turns $14 at a price index of 112 into $12.50. When the reference value is the index's own base, 100 for the CPI's 1982-1984, the result is in 1982-1984 dollars; when it is the latest month, the result is in that month's dollars. The base changes the level and never the growth rate. The BEA's implicit price deflator is this rule run backwards, "the ratio of the current-dollar value to the corresponding chained-dollar value, multiplied by 100": on FRED, GDPDEF equals 100 x GDP / GDPC1 to three decimals in all 318 quarters since 1947.
The check: the BLS's real earnings, to the cent
The BLS publishes average hourly earnings in 1982-1984 dollars and says how it gets them: "The Consumer Price Index for All Urban Consumers (CPI-U) is used to deflate earnings for the all employees series, while the Consumer Price Index for Urban Wage Earners and Clerical Workers (CPI-W) is used to deflate earnings for the production and nonsupervisory employees series."
We divided FRED's copy of the nominal series by the seasonally adjusted CPI-U, multiplied by 100, rounded half up to the cent, and compared the result with the BLS series CES0500000013, pulled from the BLS API on October 6. The two are identical in 245 of 245 months from March 2006 to August 2026. Production and nonsupervisory pay deflated by the CPI-W matches CES0500000032 in 247 of 247 months from January 2006. Both BLS series are blank for October 2025, marked "Data unavailable due to the 2025 lapse in appropriations": there is no CPI for that month, so there is nothing to deflate by. The same division with the not seasonally adjusted CPI-U reproduces only 21 of the 245 months, consistent with the technical note's statement that seasonally adjusted data are used.
The headline number takes one more step. The August release, published September 11, says: "From August 2025 to August 2026, real average hourly earnings decreased 0.3 percent, seasonally adjusted." Its Table A-1 shows the inputs: pay of $36.62 and $37.75, and a CPI-U of 323.291 and 334.131. Those give a fall of 0.259 percent, which rounds to 0.3. The BLS has since revised August pay to $37.76 (still marked preliminary), and with that figure the fall is 0.232 percent, which would round to 0.2. Computed from the cent-rounded real levels, $11.33 and $11.30, it is 0.265 percent. A tenth of a point in a published real-wage change can be a revision or a rounding step, so recompute changes from the nominal series and the index rather than from rounded real levels.
Mistake 1: reading 1982-1984 dollars as dollars
The BLS's real hourly figure for August 2026 is $11.30. Nobody is paid that: it is August's $37.76 expressed in the prices of 1982-1984. To state an old wage in today's prices, scale it by the index ratio instead. March 2006 pay of $20.04 is $33.53 in August 2026 dollars (20.04 x 334.131 / 199.700), against the $37.76 actually paid, a real rise of 12.61 percent. In 1982-1984 dollars the same two months are $10.04 and $11.30, and the unrounded values give the same 12.61 percent; only the rounded cents drift, to 12.55.
The trap is sharper when two deflators meet on one chart. The PCE price index is set to 2017 = 100, so August's pay is $28.70 in 2017 dollars by that index. Put $11.30 and $28.70 side by side and the gap between them is units, not prices. Rebase both to the same month, or compare growth rates.
Mistake 2: subtracting inflation instead of dividing
Nominal growth minus inflation is an approximation. The exact real change is (g - infl) / (1 + infl), so subtraction overstates it by a factor of one plus inflation: small over a year, large over decades.
| window | pay, nominal | CPI-U | subtract | divide | 1 + inflation |
|---|---|---|---|---|---|
| Aug 2025 to Aug 2026 | +3.113% | +3.353% | -0.240 | -0.232 | 1.0335 |
| Feb 2020 to Aug 2026 | +32.306% | +28.884% | +3.422 | +2.655 | 1.2888 |
| Mar 2006 to Aug 2026 | +88.423% | +67.316% | +21.107 | +12.615 | 1.6732 |
Over twenty years subtraction reports a 21.1-point gain where the purchasing power of an hour of pay rose 12.6 percent. The same identity gives the real return on a nominal interest rate, (1 + i) / (1 + infl) - 1. For rates, subtraction is a common convention, and our fed funds versus CPI article uses it. Across the 853 months with both figures since July 1955, the two methods are furthest apart in June 1981, when a 19.10 percent funds rate and 9.70 percent CPI inflation give 9.40 by subtraction and 8.57 by division. In August 2026, at 3.63 and 3.35, they give 0.28 and 0.27.
Mistake 3: treating the deflator as a detail
Real change in average hourly earnings to August 2026, in percent, by deflator:
| from | pay, nominal | CPI-U | CPI-W | PCE price index |
|---|---|---|---|---|
| Aug 2025 | +3.113 | -0.232 | -0.331 | -0.296 |
| Jan 2021 | +26.161 | -0.815 | -1.134 | +1.698 |
| Feb 2020 | +32.306 | +2.655 | +2.101 | +5.150 |
| Mar 2006 | +88.423 | +12.615 | +12.403 | +19.926 |
Over the latest year the three agree on the sign. Over longer windows they part, because the CPI-U rose faster than the PCE price index: 2.55 percent a year against 2.24 from March 2006 to August 2026, a gap of 0.32 point a year that compounds into 7.3 points of difference in real pay growth over the whole period. January 2021 is not the only start month that flips the sign. Taking every start month from March 2006 to August 2025, the CPI-U and the PCE price index disagree on whether an hour of pay bought more or less in August 2026 for 15 of the 234: thirteen in a row from May 2020 to May 2021, plus September 2021 and June 2025. The CPI-U puts the real change below zero for 19 start months, the PCE price index for 4.
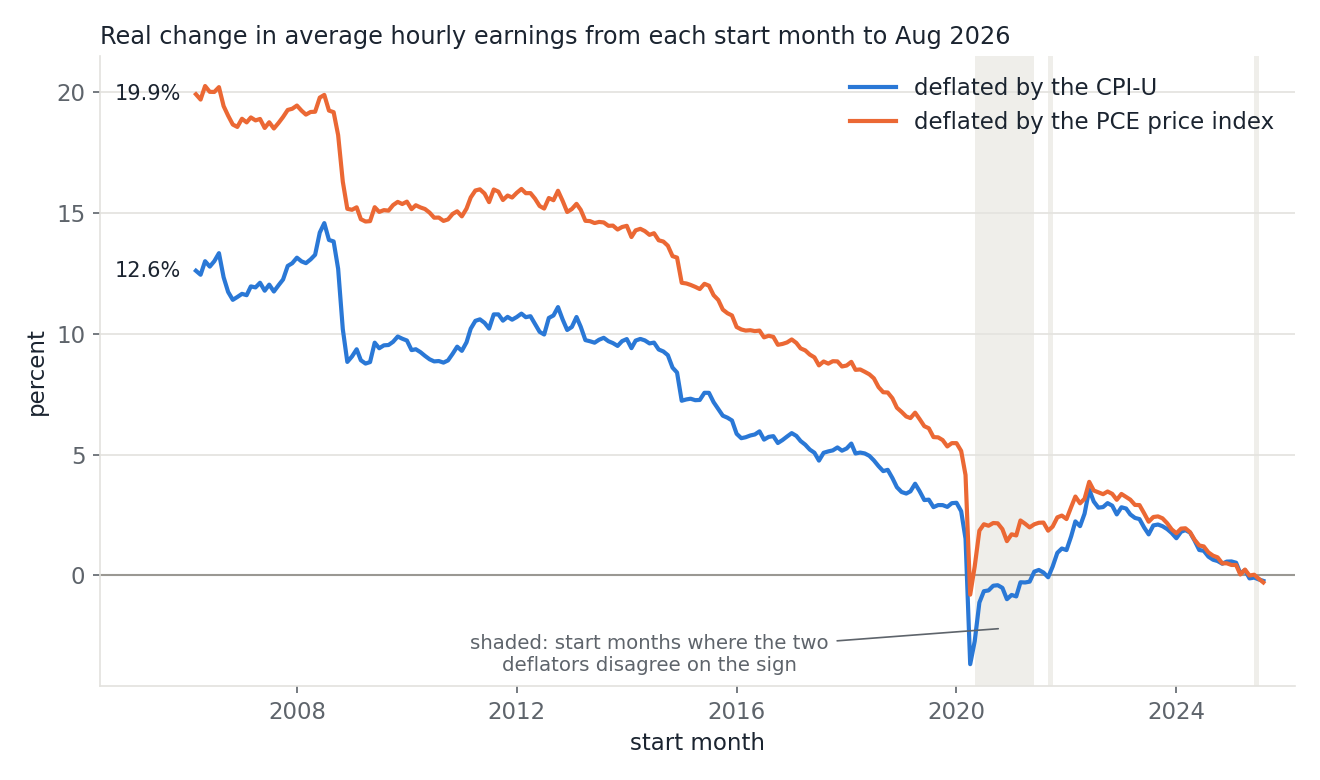
The BEA sorts the gap between the two indexes into four parts. The formula effect: "The PCE price index is based on the Fisher-Ideal formula, while the CPI is based on a modified Laspeyres formula." A weight effect, from the different importance each gives the same items. A scope effect: "PCE measures spending by and on behalf of the personal sector, which includes both households and nonprofit institutions serving households; the CPI measures out-of-pocket spending by households." And "other effects", seasonal adjustment among them. In the BEA's worked example, the third quarter of 2006, the CPI rose 3.7 percent at an annual rate and the PCE index 3.0; the weight effect contributed 0.84 point, 0.56 of it from owner-occupied housing, and the scope effect pulled the other way by 0.50. We did not reproduce that decomposition; the BEA's Table 9.1U does it.
The BEA handbook's test for choosing is short: "A price index is appropriate if its definition and coverage closely match those of the series being deflated." The BLS pairs the CPI-W, the index for urban wage earners and clerical workers, with production and nonsupervisory pay. Neither headline index is wrong for wages. The mistake is choosing one after seeing the answer, or not saying which one was used.
Mistake 4: deflating by a core index
Core indexes leave out food and energy by construction. Over the year to August 2026:
| index | inflation | real change in pay |
|---|---|---|
| CPI-U | +3.353% | -0.232% |
| CPI-U less food and energy | +2.446% | +0.651% |
| PCE price index | +3.419% | -0.296% |
| PCE less food and energy | +3.008% | +0.102% |
By either headline index, an hour of pay bought less in August 2026 than a year earlier; by either core index it bought more. The headline indexes rose faster than the core ones, so food and energy rose faster than the rest of the basket, and households pay for both. As a deflator for income, a core index drops the part of the basket that rose fastest this year. Against every start month in the sample, the CPI-U and core CPI disagree on the sign for 17, all between June 2020 and August 2025. The CPI basket article shows how much of 2026's rise came from energy alone.
Mistake 5: mixing adjusted and unadjusted series
The earnings series here are seasonally adjusted. Divide them by the not seasonally adjusted CPI-U and the monthly real change picks up the CPI's seasonal pattern. Across 243 months, the mismatched monthly change differs from the matched one with a standard deviation of 0.205 point, by -0.298 point in an average March and +0.297 in an average December, and by as much as -0.547 point in March 2012. Over twelve months the seasonal pattern mostly cancels (the largest gap is 0.280 point, the mean absolute gap 0.048), so the mismatch is easy to miss in annual comparisons and large in monthly ones. Pair adjusted with adjusted and unadjusted with unadjusted.
Mistake 6: adding up chained dollars
Real GDP and its components are published in chained 2017 dollars, and they do not add up. The BEA's handbook says so twice: "because these chained-dollar measures are not based on a single set of weights, they are not additive and thus do not yield accurate measures of shares and contributions to growth", and the components "will not necessarily sum to the chained-dollar estimate of GDP (or of any intermediate aggregate), because the relative prices used as weights for any period other than the reference year differ from those used for the reference year."
In the second quarter of 2026, real consumption, investment, government spending and net exports sum to $24,391.1 billion against real GDP of $24,408.0 billion, a residual of $16.9 billion. In the four quarters of 2017, the reference year, the residual is never more than $0.043 billion either way. In 1970 the four components add to $178.4 billion more than real GDP, 3.4 percent of it, as the handbook warns: "As one moves further away from the reference year, the residual tends to become larger". The same four components in current dollars add to nominal GDP to within $0.002 billion of rounding.
Shares go wrong by more. In 1970, government was 31.64 percent of real GDP in chained 2017 dollars but 23.53 percent of spending in current dollars, and investment 11.25 percent against 15.84. In 2025, net exports were -4.60 percent of real GDP in chained dollars against -2.99 percent in current dollars. The BEA's rule: "Because current-dollar values provide the weights for the chain-type indexes, shares calculated from these estimates rather than from the chained-dollar estimates should be used to indicate the relative importance of components." For growth, it publishes contributions to percent change computed with exact formulas, which is the series to use instead of differences in chained dollars.
What this does not show
Average hourly earnings is an average over jobs, and its mix moves. The technical note says each industry gets "a 'weight' in the published averages that corresponds to its current level of activity (employment or total hours)", and that the series are "not the earnings average of 'typical' jobs or jobs held by 'typical' workers". From February to April 2020 the average rose from $28.54 to $30.04, 5.26 percent, while the CPI-U fell 1.24 percent: a "real" gain of 6.58 percent in two months. The BLS's April 2020 release gave the reason: "The increases in average hourly earnings largely reflect the substantial job loss among lower-paid workers". No deflator corrects for a change in who is being averaged, which is why the spring 2020 start months sit apart in the chart.
The latest figures will move. August and September 2026 pay are marked preliminary, and the September CPI was not out when we pulled the data; the BLS schedules its next real earnings release for October 14, 2026. October 2025 has no CPI at all, while the PCE price index does have an October 2025 value, so a monthly series deflated by the CPI has a hole the PCE-deflated one does not. And nothing here measures any household's living standard: these are economy-wide averages and price indexes, and the ALFRED vintages article shows how far payrolls and GDP have moved after first publication.
The datasets
datasets/real-versus-nominal-deflating-correctly.csv holds 867 monthly rows from July 1954 to September 2026, with an empty cell wherever a series has no value. datasets/real-versus-nominal-deflating-correctly-gdp.csv holds 318 quarterly rows from the first quarter of 1947 to the second quarter of 2026. Run python code/real-versus-nominal-deflating-correctly.py to print every table here from the two files, --download to refresh them from FRED and the BLS API (no key needed for either; change the CONTACT line to your own), and --figures to redraw the chart. The numbers need only the standard library; the chart needs matplotlib.
_README:
date: first day of the month (monthly file) or of the quarter (GDP file)ahe_all: average hourly earnings of all employees, total private, dollars, seasonally adjusted (CES0500000003)ahe_pns: the same for production and nonsupervisory employees (AHETPI)cpi_u/cpi_u_nsa: CPI-U, all items, 1982-1984=100, seasonally adjusted (CPIAUCSL) and not (CPIAUCNS)cpi_w: CPI-W, all items, 1982-1984=100, seasonally adjusted (CWSR0000SA0)pce_price: PCE chain-type price index, 2017=100, seasonally adjusted (PCEPI)core_cpi/core_pce: the CPI-U and the PCE price index less food and energy (CPILFESL, PCEPILFE)fedfunds: effective federal funds rate, percent, monthly average of daily figures (FEDFUNDS)bls_real_ahe_all/bls_real_ahe_pns: the BLS's own series in 1982-1984 dollars (CES0500000013, CES0500000032)- GDP file:
gdp,pce,investment,government,net_exportsin billions of current dollars (GDP, PCEC, GPDI, GCE, NETEXP); the same names with_realin billions of chained 2017 dollars (GDPC1, PCECC96, GPDIC1, GCEC1, NETEXC; real net exports start in 1970);gdp_deflator, the implicit price deflator, 2017=100 (GDPDEF); all seasonally adjusted, at annual rates where in dollars