Methods3,191 words, 15 minutes
Nelson-Siegel on the Treasury curve: where three numbers miss
Nelson-Siegel fitted to 11 Treasury yields on 5,171 days misses by 9.4 bp on a median day; since May 2020 the 20-year sits above a curve fitted without it daily.
Three numbers describe the Treasury yield curve well enough to be useful and badly enough to be interesting. We fitted the Nelson-Siegel curve, in the form Diebold and Li made standard, to the eleven constant-maturity Treasury yields FRED publishes, on every one of the 5,171 trading days from 9 February 2006 to 8 October 2026 on which all eleven exist. On the median day the fit misses by 9.4 basis points (root mean squared error across the eleven maturities). The misses are not noise. Most of them form the same wave every day, which a better decay parameter or a second hump removes. Two do not go away so easily: the 1-month bill and the 20-year bond, the two maturities the Federal Reserve's own curve-fitters chose to leave out of their estimation. Since the 20-year bond came back on 20 May 2020, it has sat above a curve fitted without it on all 1,598 trading days, by 21.0 basis points on average.
This is item 29 on our methods list. It builds on the bond math article, which priced single bonds off the par curve, and on the inversion history, which watched one spread. Here the whole curve is the object.
The model in one line
Nelson and Siegel (1987) proposed a forward-rate curve with a handful of parameters. The version almost everyone uses now is Diebold and Li's factorisation of the yield curve, which we read in their 2003 NBER working paper:
y(t) = b0 + b1 · (1 − e^(−λt)) / (λt) + b2 · [(1 − e^(−λt)) / (λt) − e^(−λt)]
where t is the maturity. Each of the three terms has a fixed shape, its "loading", and a daily weight:
- the loading on b0 is 1 at every maturity, so b0 moves the whole curve: the level;
- the loading on b1 starts at 1 for the shortest maturity and decays to 0, so b1 moves the short end more than the long end: the slope. b0 + b1 is the curve's value at maturity zero;
- the loading on b2 starts at 0, rises to a hump and decays back to 0, so b2 bends the middle: the curvature.
The decay λ decides where the hump sits. Diebold and Li fixed it, and said why: "Two- or three-year maturities are commonly used in that regard, so we simply picked the average, 30 months." The λ that puts the peak exactly there, they write, is 0.0609. The curvature loading peaks where λt = 1.7933, which puts their hump at 29.45 months; rounding λ to four decimals is why that is not exactly 30. Fixing λ is what turns a nonlinear fit into three-variable ordinary least squares, solved in closed form each day. That convenience is the whole reason the method spread.
Our listing works in years, so λ = 0.0609 × 12 = 0.7308. The loadings, verbatim from the attached script:
def ns_row(t: float, lam: float) -> list[float]:
    x = lam * t
    s = (1 - math.exp(-x)) / x
    return [1.0, s, s - math.exp(-x)]
The data
FRED carries the Board of Governors' H.15 constant-maturity yields at eleven maturities: 1, 3 and 6 months, and 1, 2, 3, 5, 7, 10, 20 and 30 years (series DGS1MO through DGS30). All eleven series pages carry the tag "Public Domain: Citation Requested", so the attached files can include them. We pulled them on 13 October 2026 from FRED's public CSV endpoint, with no key, after reading FRED's robots.txt.
Three facts about these numbers matter for what follows:
- They are par yields, read off Treasury's own curve. Treasury's methodology page says "The Treasury's official yield curve is a par yield curve derived using a monotone convex method", built from bid-side quotes for "the most recently auctioned" bills, notes and bonds, which are "sequentially priced without error". So each point is already the output of a curve that passes through the newest securities. Nelson and Siegel wrote their curve for forward rates and zero-coupon yields; fitting it to par yields is a common shortcut, and a limitation we come back to.
- The 30-year has an estimated stretch. FRED's DGS30 notes say the series "was discontinued on February 18, 2002, and reintroduced on February 9, 2006". The file still has values in between. The Board's H.15 release explains them in a footnote: over those four years "the U.S. Treasury published a factor for adjusting the daily nominal 20-year constant maturity in order to estimate a 30-year nominal rate". A 30-year number built from the 20-year would bias exactly the comparison this article makes, so the sample starts on 9 February 2006, when a market 30-year yield came back. All eleven files have values from 31 July 2001, when the 1-month series starts.
- The 20-year changed meaning in 2020. Treasury's page says that before "the re-introduction of the 20-year Treasury bond on May 20, 2020", its curve "had used additional inputs that were composites of off-the-run bonds in the 20-year range". Since then the input has been the on-the-run 20-year bond itself.
The panel has 5,171 days, the last of them 8 October 2026.
One day, worked through
On 8 October 2026 the eleven yields ran from 4.14% at one month to 5.64% at twenty years, with the 30-year at 5.60%, below the 20-year. The Board's H.15 release of 9 October 2026 prints the same eleven yields for that day. Least squares with Diebold and Li's λ gives b0 = 5.6538, b1 = −1.4913 and b2 = −0.7756. Each fitted yield is b0 plus each weight times its loading. At 10 years, for example, the slope loading is 0.1367 and the curvature loading is 0.1361, so the fit is 5.6538 − 1.4913 × 0.1367 − 0.7756 × 0.1361 = 5.344%, against an actual 5.22%: a miss of −12.4 basis points.
| Maturity | Actual (%) | Slope loading | Curvature loading | Fitted (%) | Miss (bp) |
|---|---|---|---|---|---|
| 1M | 4.14 | 0.9702 | 0.0292 | 4.184 | −4.4 |
| 3M | 4.23 | 0.9140 | 0.0810 | 4.228 | +0.2 |
| 6M | 4.30 | 0.8377 | 0.1437 | 4.293 | +0.7 |
| 1Y | 4.44 | 0.7095 | 0.2279 | 4.419 | +2.1 |
| 2Y | 4.75 | 0.5255 | 0.2937 | 4.642 | +10.8 |
| 3Y | 4.85 | 0.4052 | 0.2935 | 4.822 | +2.8 |
| 5Y | 4.99 | 0.2666 | 0.2407 | 5.070 | −8.0 |
| 7Y | 5.11 | 0.1943 | 0.1883 | 5.218 | −10.8 |
| 10Y | 5.22 | 0.1367 | 0.1361 | 5.344 | −12.4 |
| 20Y | 5.64 | 0.0684 | 0.0684 | 5.499 | +14.1 |
| 30Y | 5.60 | 0.0456 | 0.0456 | 5.550 | +5.0 |
The root mean squared miss that day is 8.02 basis points, close to the sample median. The signs tell the story the rest of this article measures. The 2-year sits above the curve, the 5- to 10-year stretch sits below it, and the 20-year sits furthest above. A curve with one hump cannot rise to 20 years and then fall to 30, and on this day the actual curve does exactly that. The weights read sensibly too. b0 + b1 = 4.16% is the curve's value at maturity zero, between the 1-month and 3-month yields, and the negative b1 says the curve slopes up.
How close three numbers get
Across all 5,171 days, the Diebold-Li fit has a median daily miss of 9.40 basis points, a mean of 10.49, a 90th percentile of 19.26 and a worst day of 48.70, on 21 April 2023. That day explains itself: the 1-month yield was 3.36% and the 3-month 5.14%, a gap of 178 basis points inside two months. No smooth three-term curve can bend that hard, and the fit missed the 1-month by −115.8 basis points. The six worst days all fall between 18 and 26 April 2023; the seventh is 20 August 2007, at 34.96.
For scale, Diebold and Li's own Table 2 reports per-maturity residual RMSEs between 4.0 and 8.2 basis points. Their setting was easier: monthly Fama-Bliss zero-coupon yields from 1985 to 2000, with maturities from 3 to 120 months. Our errors by maturity run from 5.2 basis points at 3 years to 15.2 at 1 month, on daily par yields out to 30 years.
The misses have a shape
Average the daily misses by maturity and the pattern is hard to miss: the left-hand bars in the chart.
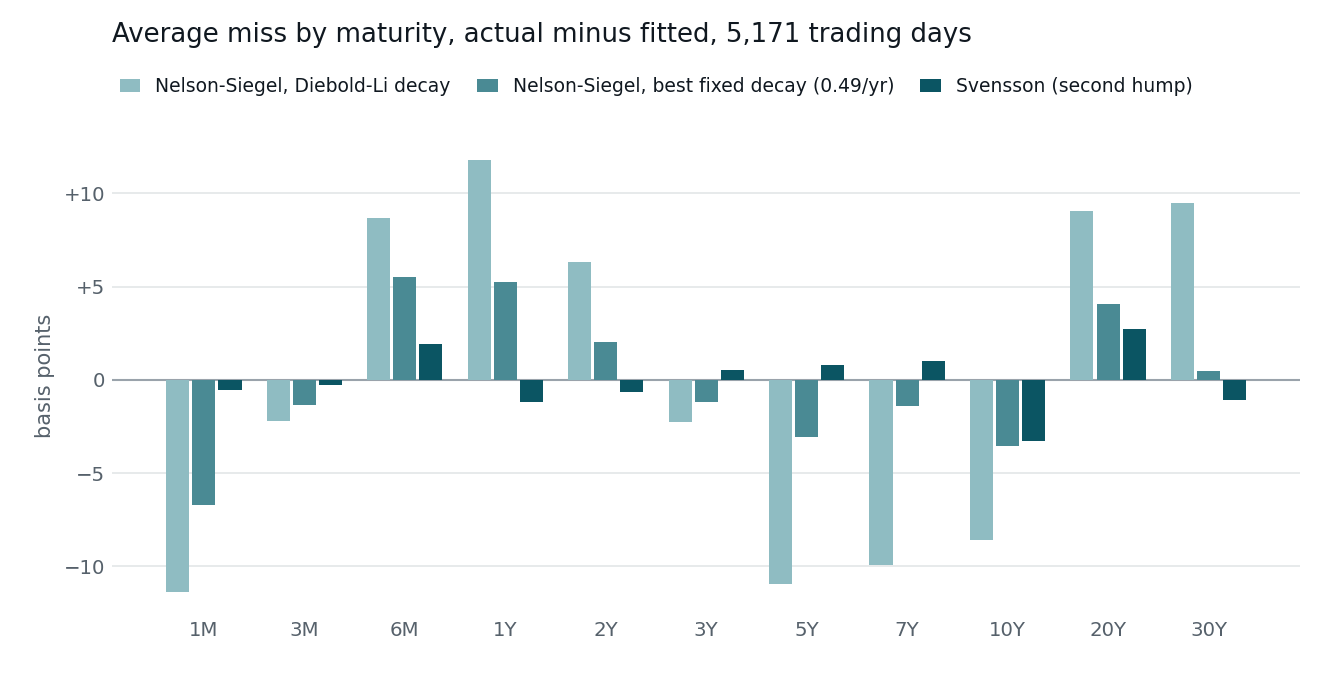
With Diebold and Li's decay, the 6-month yield sits above the curve on 93.2% of days and the 1-year on 91.5%, while the 5-year sits below it on all but 6.3% of days and the 10-year on all but 3.9%. Errors that keep the same sign at the same maturity, day after day, are not measurement noise. They are the model's shape disagreeing with the market's.
The obvious suspect is λ. Diebold and Li chose it for a curve that ended at 10 years. Ours runs to 30, so we searched for the single λ that minimises the squared errors over every day and maturity at once (a grid from 0.050 to 3.000 per year, in steps of 0.005). The answer is 0.490 per year, or 0.0408 per month, which moves the curvature hump from 2.45 years to 3.66 years. The median daily miss falls from 9.40 to 7.10 basis points and the wave roughly halves. The 5-year's average miss goes from −10.97 to −3.07 basis points, and the 30-year's from +9.47 to +0.47.
Two maturities improve least. The 1-month still averages −6.72 basis points with an RMSE of 14.73, the largest of the eleven, and the 20-year still averages +4.07.
Buying flexibility
There are two standard ways to buy a better fit, and both have a price.
Let λ float every day. Searching each day for its own λ (0.05 to 3.00 per year, step 0.01) cuts the median miss to 4.49 basis points. The price is meaning. The chosen λ ranges from 0.19 to 1.17 between the 10th and 90th percentiles, so "curvature" refers to a hump near 9 years on some days and near 1.5 years on others. On 432 days the best λ is pinned at one end of the grid, which means the fit wanted a value outside any sensible range. The day-to-day move is usually small (median 0.01), but on 89 days λ jumps by 0.5 or more. When b2 is near zero, λ barely affects the fit at all and is poorly identified. That is exactly the instability Diebold and Li avoided by fixing it.
Add a second hump. Svensson's 1994 extension adds a fourth term, a second curvature loading with its own decay. It is the form behind the Gurkaynak-Sack-Wright curve, a Federal Reserve Board staff paper whose daily estimates are posted with it on the Board's website. The paper gives the reason: Nelson-Siegel "tends to have the forward rates asymptote too quickly to be able to capture the convexity effects at longer maturities", and "the yield curve typically needs a second hump, one that usually occurs at long maturities". We kept both decays fixed over the sample and searched a grid. The best pair is 1.15 and 0.60 per year, with humps at 1.56 and 2.99 years. The median miss drops to 4.54 basis points, and no maturity's average miss is larger than 3.31 basis points (the darkest bars).
Our sample-wide second hump sits at 3 years, not at the long end where the Fed's paper puts it. That is a consequence of our choice: Gurkaynak, Sack and Wright estimate their parameters day by day on the individual outstanding notes and bonds, while we fix two decays across twenty years of eleven points. Our fixed second hump buys back the middle of the curve. It does not buy back the 20-year, which keeps the largest RMSE of the eleven maturities under Svensson (8.54 basis points, with the 30-year next at 8.17).
| Fit | Parameters per day | Median daily miss (bp) | 90th percentile (bp) | 1M average miss (bp) | 20Y average miss (bp) |
|---|---|---|---|---|---|
| Nelson-Siegel, Diebold-Li λ | 3 | 9.40 | 19.26 | −11.41 | +9.07 |
| Nelson-Siegel, best fixed λ | 3 | 7.10 | 12.57 | −6.72 | +4.07 |
| Nelson-Siegel, λ free each day | 4 | 4.49 | 8.71 | not kept | not kept |
| Svensson, both decays fixed | 4 | 4.54 | 7.11 | −0.52 | +2.75 |
The two maturities the Fed leaves out
Gurkaynak, Sack and Wright list what they exclude from their estimation, and two of their exclusions match our two stubborn maturities. They drop "all Treasury bills out of concern about segmented markets", citing Duffee (1996), who "showed that bill rates are often disconnected from the rest of the Treasury yield curve", and they drop "all securities with less than three months to maturity, since the yields on these securities often seem to behave oddly". Later in the paper they add that the shortest maturities are affected by "seasonal patterns in Treasury bill issuance and the timing of FOMC meetings". And: "We begin to exclude twenty-year bonds in 1996, because those securities often appeared cheap relative to ten-year notes with comparable duration," which "could reflect their lower liquidity or the fact that their high coupon rates made them unattractive to hold for tax-related reasons."
So we did the same thing on our panel. We fitted the Diebold-Li curve to the other nine maturities and then asked where the 1-month and the 20-year fell relative to it. This test is out of sample, because neither point can pull the curve towards itself. The nine-point fit has a median miss of 8.12 basis points. The 1-month yield averages 19.95 basis points below the curve and is above it on only 8.4% of days. The 20-year averages 11.79 basis points above it and is above it on 78.3% of days.
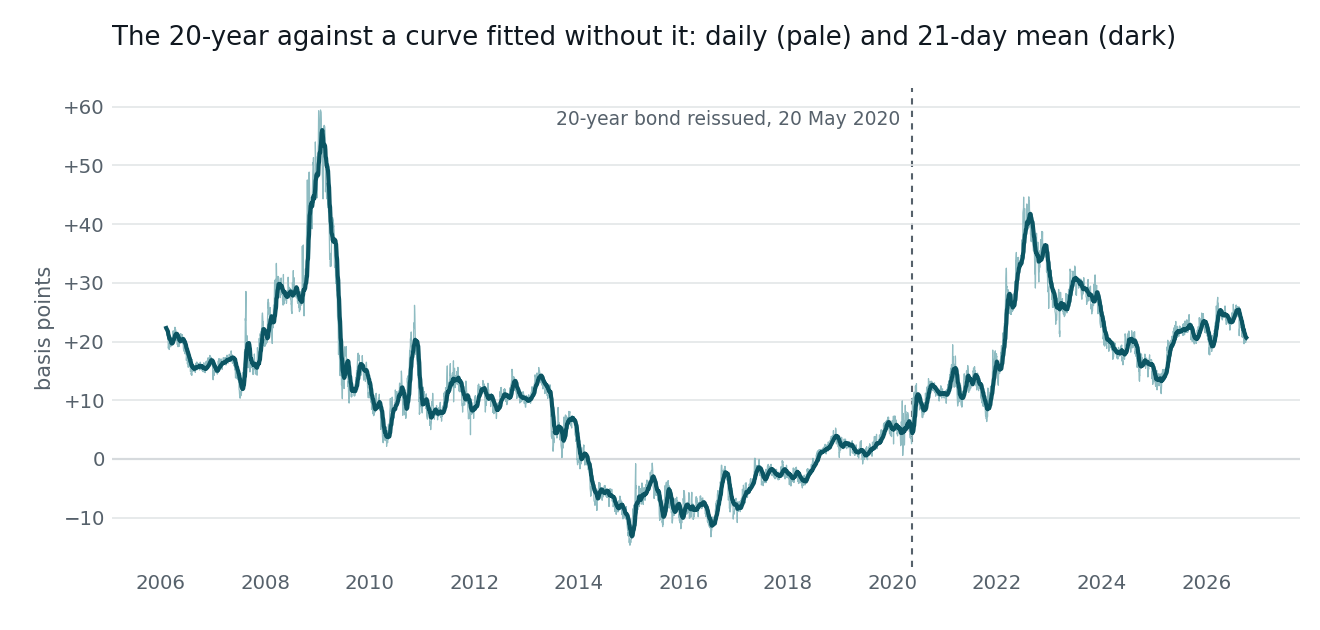
The 20-year's miss is not constant. It averaged +31.1 basis points in 2008 and peaked at +59.44 on 22 January 2009. It turned negative from 2014 to 2018 (−7.5 in 2016), then rose again. The break that stands out is the one Treasury's methodology page dates:
- Before 20 May 2020 (3,573 days, when the 20-year point came from composites of off-the-run bonds): an average out-of-sample miss of +7.67 basis points, above the curve on 68.6% of days, and the 20-year yield above the 30-year on 743 days (20.8%).
- From 20 May 2020 (1,598 days, with an actual 20-year bond as the input): an average miss of +20.99 basis points, above the curve on 100.0% of days (the smallest miss was +6.27), and the 20-year above the 30-year on 982 days (61.5%).
A 20-year yield above both its neighbours' smooth interpolation, and often above the 30-year, is the kind of "cheapness" that led Gurkaynak, Sack and Wright to drop 20-year bonds from 1996, and it has been in the published numbers on every day since the bond's return. What this test can say is where and how much: it measures cheapness against a smooth curve. Why the bond trades cheap (liquidity, demand, supply) is a separate question that eleven daily yields cannot settle, and we do not try to.
What the three numbers mean
Diebold and Li check their factors against data-based measures: the 10-year yield for level, the 10-year minus the 3-month for slope, and twice the 2-year minus the 3-month and the 10-year for curvature. They report correlations of 0.97, −0.99 and 0.99 on their 1985-2000 sample. On ours, with their λ, the same three come out at 0.910, −0.997 and 0.976. b0 + b1 tracks the 3-month yield with a correlation of 0.997.
Slope and curvature carry over cleanly. Level carries over less well, and it is worth knowing why before using b0 as "the long rate". In the formula b0 is the curve's limit at infinite maturity. On a curve that stops at 10 years that limit sits near the 10-year yield. On a curve that runs to 30 years, with a 20-year that often sits above the 30-year, the limit is pulled by the long end. On 8 October 2026, b0 was 5.65% while the 10-year was 5.22%.
What this does not show
- Par, not zero-coupon. The constant-maturity yields are par yields from Treasury's own monotone convex curve. Nelson-Siegel is a model of zero-coupon and forward rates, so the fitted b's here describe the shape of a par curve and should not be used to discount cash flows. The Gurkaynak-Sack-Wright curve fits individual securities' prices and publishes zero-coupon yields for that purpose.
- A fitted curve on top of a fitted curve. Every input is already an interpolation through on-the-run quotes. Our misses measure the distance between Treasury's curve and a three- or four-term smooth one, not between a model and traded prices.
- Grids, not optimisers. Every λ here comes from a grid search: 0.005 per year for the best fixed value, 0.01 per day for the free one, 0.05 and 0.01 for the Svensson pair. A finer search moves the decimals, not the pattern. Equal weights on all eleven maturities are also a choice: the five maturities of 2 years and under get almost half the weight.
- No forecasting. Diebold and Li's paper is about forecasting with these factors. We only fit curves, and nothing here tests whether b0, b1 or b2 predict anything.
- Not advice. A maturity that sits above a smooth curve is not a trade. The miss can persist for years, as the 2006-2013 stretch shows, and nothing here counts costs, financing or risk.
The FOMC event study and the correlation instability article use the 2- and 10-year yields as single series. This fit is a way to see those two as parts of one curve.
Reproducing it
code/nelson-siegel-yield-curve-fitting.py uses only the standard library for every number, solving each least-squares fit by Gaussian elimination. --download reads FRED's robots.txt, keeps its crawl delay (at least one second) between the eleven requests and fetches the series with no key. --raw-dir reads saved copies instead, --csv writes the two files below, and --figures redraws both charts with matplotlib. The global λ searches use one shortcut: the total squared error for a fixed design is trace(M) minus the sum of the projection matrix times M, where M is the 11 × 11 sum of y·yᵀ over all days. That turns a search over 591 decays, or 4,950 Svensson pairs, into seconds. A full run took under five seconds when we built this article.
The two files are datasets/nelson-siegel-yield-curve-fitting.csv (44 rows: four fits × eleven maturities) and datasets/nelson-siegel-yield-curve-fitting-daily.csv (5,171 daily rows, 9 February 2006 to 8 October 2026).
_README:
- summary file:
model, one ofdl(Diebold-Li λ),best(best fixed λ),svensson(both decays fixed) orexcl(the Diebold-Li curve fitted without the 1-month and 20-year, so those two rows are out-of-sample misses);decay_per_year(two values for Svensson);maturityand its FREDseries;days;mean_error_bp,mae_bpandrmse_bpof actual minus fitted;share_above, the share of days the actual yield was above the curve - daily file:
date;b0,b1andb2from the Diebold-Li fit (percent);rmse_dl_bp;free_decayandrmse_free_bp, the day's own best λ and its miss;rmse_svensson_bp;error_1m_bpanderror_20y_bpfrom the Diebold-Li fit;error_20y_excl_bp, the 20-year's miss against the nine-maturity curve